Interested in how many people are reading your blog? Want to know what the most popular blog post you wrote is?
On your statistics page you can easily find this and much more information, all from inside your dashboard under Dashboard > Statistics.
Statistics is an Edublogs Pro and CampusPress feature only. The data is sourced from Google Analytics.
Visitors
The visitors module contains a wealth of information that is displayed as an interactive graph with detailed statistics below. By default, the graph is set to display the last month (30 days) of visitor data, but can also be set to 3 months or the last year.
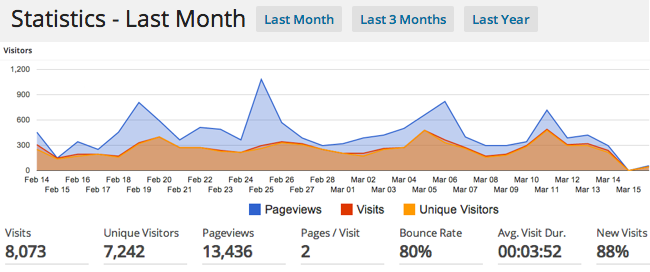
Visits
Visits are counted as the number of times people came to your blog, in this case, over the course of the past month. If you visited the same blog five times during this past month, it would be registered as five different visits to the blog.
Unique Visitors
Unique visits are only registered once over a given time period for each device/browser. If you visited the same blog five times during this past month (using the same computer and browser), you would be registered as one unique visitor over the course of the past month.
Keep in mind that unique visitors is a bit of a misnomer. If you viewed a blog on your phone one day, your computer the next, and a tablet on the third day, this would be registered as three unique visitors.
Pageviews
A view is counted every time a visitor opens or reloads a webpage on your blog. If you went first to a blog’s home page, then visited the about page, and finally a contact page, you would have registered three different pageviews during a single visit. Note that opening the same page multiple times will register multiple views.
Pages/Visit
Pages per visit calculates the average number of pages that a visitor loads during a single visit to your blog.
Bounce Rate
Bounce rate refers to the percentage of visitors who load a single page on your blog, and then leave without any additional interaction. Ideally, you would want your visitor to come to your website, then click a link to another article, or perhaps view your about page, or complete some additional interaction. The lower your bounce rate is, the better. It serves as an indicator of how engaging your content is.
Average Visit Duration
Average visit duration is exactly as it sounds, the average length of time a visitor spends on your blog during one visit.
New Visits
Google tracks visitors to your blog with little bits of information stored in a cookie. The percentage of new visits tells you roughly how many visits are new unique visitors as opposed to those who have been to your blog in the past. Keep in mind that this benchmark changes periodically as the cookies are cleared from the person’s browser (it might not mean they have never visited your blog, rather that it was a couple of months ago).
Visitor: Country
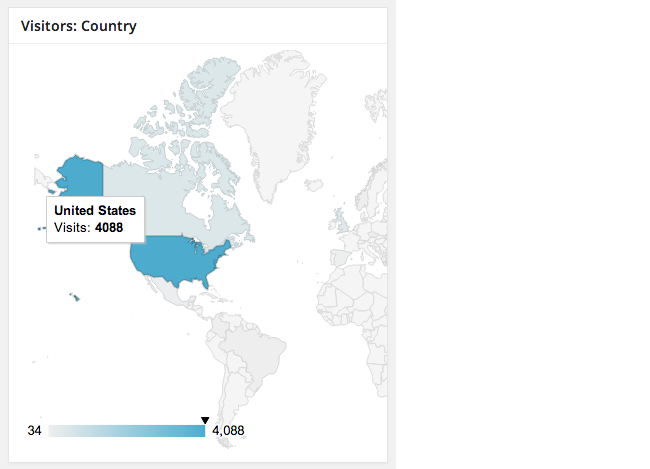
The Visitors: Country module displays relevant geographic data about where visitors to your blog are coming from.
When your Visitors module is set to “Last Month,” the data on the map will correspond with only the visitors from each country that have visited your blog in the last month. Feel free to adjust the timeline on the Visitors module to 3 months or last year, and the map will adjust accordingly.
You can scroll on the map to view different portions of the world as the entire map isn’t shown when the module loads.
Notice that different countries are highlighted in different shades of the primary color (blue). The darker the shade indicates the larger the relative population of visitors from that country. In this case, The United States is the darkest shade of blue because many more visitors came to this blog from the United States as opposed to any other country.
The legend in the lower left-hand corner of the module shifts the arrow to show you a country’s number of visitors when you select a country. In this case, the arrow points directly on 4,088, the largest number of visitors from any country. On the other end of the spectrum, the fewest visitors this blog had in the past month was from Kenya (34). Note that this does not take into account countries that had 0 visitors during the past month.
Content
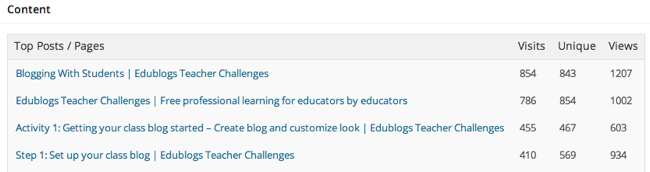
The Content module displays the posts and pages that visitors have accessed most frequently over the past month, 3 months, or last year (can be toggled in the Visitors module).
Statistics prioritizes Visits, then Unique Visits, then views. In the image above, notice how the second article actually had more Unique Visitors than the first, yet the first had more visits, so it is prioritized first.
Referrers
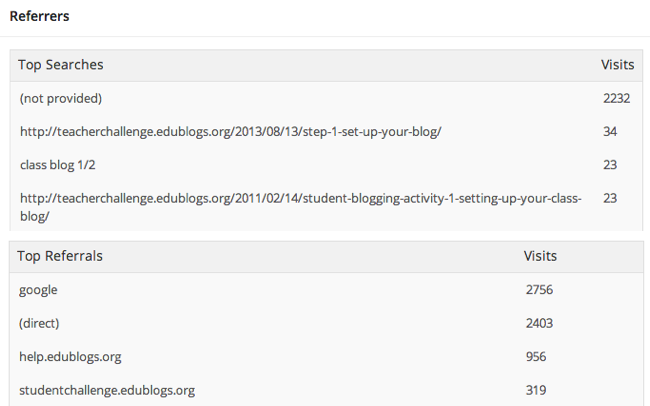
Data from the Referrers module shares information on how visitors get to your blog in the first place.
Top Searches
Top Searches provides information on what keywords visitors typed into search engines that resulted in them visiting your blog. Due to changes in how Google Analytics handles privacy of that data, most of your top searches will probably be displayed as “not provided.”
Top Referrals
Top Referrals provides information about what sources visitors came from to access your blog. Google, Bing, and Yahoo generally indicate that a large percentage of your viewers are coming directly from search engine queries. Direct referrals (direct) indicate visitors who type your URL directly into the browser, click on a bookmark they have saved, or click on a link in an email or other source that doesn’t track data (like a Word document).
Additional Information
Can I use Google Analytics?
The data display on your statistics page is sourced from Google Analytics. For more detailed Google Analytics data, you can connect your own Google Analytics account to your account in Settings > Google Analytics. This provides more detailed statistics which you view inside your Google Analytics account.
Please note if you set up Google Analytics in Settings > Google Analytics it replaces the data being source from the network Google Analytics account with the data from your Google Analytics account. It can take up to 48 hours to display the new data and during this time you may see no data displayed in Dashboard > Statistics.
This is an Edublogs Pro, student blog attached to My Class and CampusPress feature only.
Can I display a hit/view counter on my blog?
Yes, you can install a ClustrMaps, Flag Counter, Feedjit, Revolver Map or any other popular visitor tracking widget to your blog by pasting their embed code in a text widget in your sidebar. This is an Edublogs Pro, student blog attached to My Class and CampusPress feature only.